
Success in executing business strategy remains elusive. Norton and Kaplan claim that nine out of ten companies fail to execute strategy. This is similar to the success rate, or should we say failure, of new ventures. However, here we are talking about organizations that have invested significant amounts of time from their higher-up echelons, paid small fortunes to consulting firms to come up with strategy documents that, at best, get translated for the lay person and disseminated throughout the organization. Office employees, shop floor workers and even managers receive this information by sitting in a meeting where the CEO talks on a screen about the strategy and how, this time, rest assured, it will happen. They may even receive a cue card or some kind of material to reinforce the spiel. After the meeting, most often than not, they return to their jobs and continue doing exactly the same thing they were doing before, exactly the same way. At the end very little happens and, the following year, the cycle repeats.
A solid strategy, a real one, exudes direction for execution. It clearly defines what needs to be different to achieve organizational objectives, and how each department will contribute, what will be done differently and what will be done no more (always so hard…). When executives produce this level of strategy, middle managers have something solid to work on, as they just have to acquire or deliver the capabilities that will allow the business to achieve their targets in business objectives, which in turn will be reflected in financial indicators (growth, increased profits, etc.). This should be the norm, but it is the exception. But this is formulation, the relatively good link of the chain. God protects us.
In the majority of organizations that have a strategy formulation process, a step of translation is needed, mainly because formulation is poor. This is usually the responsibility of internal consultants or planning departments, who link financial projections to targets for KPI’s (key performance indicators) and identify the projects and/or operational activities that will generate the expected targets. And here is where this nice (really?) story breaks apart. Very few companies have the talent or the tools to run simulations that generate targets for KPI’s that could be sufficient to achieve financial projections. As an example, the organization estimates that in order to increase revenue by 5% annually, they need to increase the average number of line items per order. The current value of the KPI is 3.2, and this needs to increase. The question is by how much, and when. Targets for KPI’s should be synchronized with targets for financial indicators. In most companies this exercise is just a guess. Modeling, when available, usually gives the final target for each operational result required to achieve the desired financial performance in the “to-be” or desired scenario. However, intermediate targets for KPI’s are no more than a guess. Someone may catch the idea that until we deliver some projects we cannot expect change, so the first year is usually flat or minimal change, but after that, it will just climb to wherever it needs to get, likely using a linear scale, which is almost never right. In most cases there is no simulation, so even the final targets for the KPI’s are nothing but a guess.
The second part of the question formulated above, the “when” refers to how the KPIs will progress from their current measurement to the desired target. Expected change in a KPI, besides external factors, is related to the completion of projects and operational initiatives identified as a result of planning; at least this is the way it should be done. Projects will likely deliver capabilities that will enable the business to do things they couldn’t do before, or do things differently. It is through the use of new capabilities that the KPI’s will get impacted, together with operational initiatives that are not necessarily projects (i.e. rationalization of distributors, adjust credit rules, etc.). Both projects and operational initiatives have one thing in common: they take time and have an end date, and it is only after the end day and usually with some lag, that effects can be measurable in the KPI.
Besides timing, each project or operational initiative will have a relative contribution. As an example:
- Project A has a contribution of 30%, Project B of 50% and Operational Initiative C, 20%.
- The delta between the current value of the KPI (3.2) and target value (5) is 1.8
- This delta is then prorated to the projects and initiatives, based on their relative contributions
- Considering expected delivery and lag to see results after delivery, the contribution in each year from each project or initiative can be calculated
- Adding the yearly increments from each contributor, the targets for the KPI can be calculated
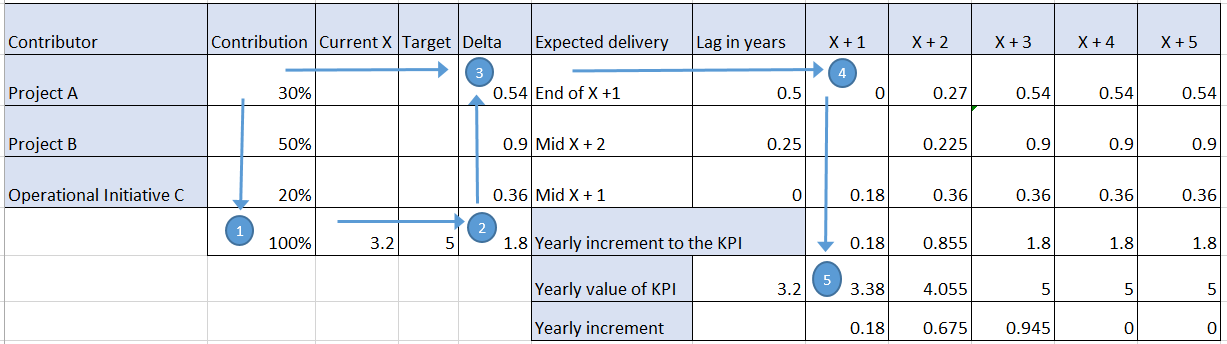
Fig 1.
In this example:
- There is only a minor improvement in the indicator or KPI in year x +1 (0.18)
- In year x +2 the increment is more than three times the previous year increment (0.675)
- In year x +3 the increment takes the KPI to the target, the increment starts to level, and is only 50% higher than the previous year (0.945)
This example clearly drives the point that targets for KPIs cannot be arbitrary and certainly not linear. However, this is just the plan, and projects get delayed and/or re-scheduled, and changes impact the ability of the business to achieve targets, creating a perception of failure that is not real, just the consequence of business decisions. This is what, intuitively, has driven a wedge between operations and project delivery, as projects do not get to production quick enough to generate the expected business results.
From the financial perspective, investments in projects do not generate the expected impact on growth, revenue or cost reduction, creating yet another perception of failure that is perfectly explainable considering actual project delivery.
At this point in the discussion, the need to link project delivery to operational results (KPIs) and financial results should be evident. Current approaches to implement strategy execution, like Kaplan and Norton’s Balanced Scorecard, cover the concept of contributions, but do not reflect the “kronos” aspect, the timing of all these pieces, which are not random balls in the air, but synchronized gears in a machine with a logic that very few people in the organization understand. This clearly explains the frustration and lack of results in strategy execution, benefit realization management, portfolio management and all other approaches that try to manage these pieces as independent silos.
Synchronized Strategy Execution is, in essence simple: there is no “secret sauce”, no more logic than the one presented in Figure 1. However, capturing the cause-effect relationships for a Strategic Business Unit between initiatives, capabilities, operational results and financial results, plus the relative contributions among all these elements, can appear like a daunting task. This simple but laborious mathematical problem can, and has been resolved with relatively simple modeling tools, and it is not an obstacle to the implementation of this approach.
When cause and effects relationships between projects and operational results have been defined and can be managed, benefits from projects are simply reflected, through relative contributions, on operational results. At this level, management of benefits does not represent an additional layer of work, as it is significantly simplified due to:
- Reduction in the problem of double counting benefits from multiple projects, added to the impact of projects from previous portfolio years. It is frequent that the same benefits are claimed by different projects, year after year, and seldom realized or verified.
- Estimation of benefits through contribution to financial results is relatively easy to calculate and easy to verify. Tracking operational results is part of the day to day operation, so no extra work is required, so it gets done.
Finally, the concept of consistency in results is the “icing on the cake” in this approach. Consistency in the results from the three “realms”: project delivery, operational results and financial results; provides valuable insight into the viability of the strategy. Common scenarios are:
- Sunny day: projects are delivering as planned and operational results are meeting expected targets, while financial results also meet the expected targets. Life is good.
- Cloudy day: project delivery is behind, and so are operational results. As a consequence, financial results are not getting the expected targets either. Not nice, but it makes sense. Corrective action is needed in portfolio management, maybe architecture, as well as in project delivery.
- Confusing and expensive: projects are delivering as planned, but operational results are not reaching targets. This can mean two things:
- The model is missing something: operational results are impacted by other factors not considered in the analysis, which explain the variance between expected and actual measures.
- Projects are delivering on time, on budget and to requirements, but fitness for use (the second component of quality) is not there. In other words, the business is not getting the expected results from the capabilities delivered, achieving no impact on operational results.
- Confusing and embarrassing: Projects are delivering as planned, operational results are being achieved as expected, but financial results are not there. This scenario could mean two things:
- External factors not considered in the cause-effect analysis, explain the financial results (i.e. changes in the environment, assumptions that did not materialize, etc.).
- The strategy is flawed and the plan, even when execution is successful, is not capable of achieving the expected financial results. This is probably the most difficult scenario to manage, particularly when it comes to communicating this to the “executive row”.
Synchronized Strategy Execution is a simple solution to three very complex problems: strategy execution, project selection/portfolio management and benefits realization management. As with any approach related to strategy, this cannot guarantee success, but it will get all the pieces done in a smart and effective way, providing executives with the information they need to manage strategy execution.